Showing posts with label pie. Show all posts
Showing posts with label pie. Show all posts
Wednesday, April 29, 2015
adobe,
chart,
cs6,
illustrator,
pie,
tool,
tutorial
1 comments
Adobe Illustrator CS6 Tutorial Pie Chart tool
First draw out a chart with the Pie Chart tool.

First you put in the information for your chart, or import it from an excel file:

Your chart will look like this at first. (You might have a legend, too.)

I prefer colored charts instead of the grayscale default Illustrator makes. Using the white arrow select a slice and choose a color from your swatches to change it.

To make your chart 3d, select it first with the black arrow. Then go to Filters>3D>Extrude and Bevel. Use the settings in the example below:

Now your chart should look like this.

You can pull apart and edit the individual slices with the white pointer tool.

Since the title of my information is about mutations, I’ll draw some mutations on the different slices, starting with the dark purple. I drew the hand and shadows around it on a separate layer with the pen tool. I also locked the chart layer while I was doing this.

I drew the eye on the same layer with the pen tool.
Adobe Illustrator CS6 Tutorial Pie Chart tool.

I added some chemical bubbles on the green slice. They were created from a cut circle with transparent highlights.

I added tentacles on the last slice with the pen tool.

Then I added a title and labels.

For some charts you might only want to spice up the most important slice or the biggest one. Although most topics aren’t as fun as mutations, any sort of added graphics make boring charts look a lot better.
Adobe Illustrator CS6 Tutorial Pie Chart tool.
Read more »
First you put in the information for your chart, or import it from an excel file:
Your chart will look like this at first. (You might have a legend, too.)
I prefer colored charts instead of the grayscale default Illustrator makes. Using the white arrow select a slice and choose a color from your swatches to change it.
To make your chart 3d, select it first with the black arrow. Then go to Filters>3D>Extrude and Bevel. Use the settings in the example below:
Now your chart should look like this.
You can pull apart and edit the individual slices with the white pointer tool.
Since the title of my information is about mutations, I’ll draw some mutations on the different slices, starting with the dark purple. I drew the hand and shadows around it on a separate layer with the pen tool. I also locked the chart layer while I was doing this.
I drew the eye on the same layer with the pen tool.
Adobe Illustrator CS6 Tutorial Pie Chart tool.
I added some chemical bubbles on the green slice. They were created from a cut circle with transparent highlights.
I added tentacles on the last slice with the pen tool.
Then I added a title and labels.
For some charts you might only want to spice up the most important slice or the biggest one. Although most topics aren’t as fun as mutations, any sort of added graphics make boring charts look a lot better.
Adobe Illustrator CS6 Tutorial Pie Chart tool.

Sunday, March 29, 2015
chart,
graph,
in,
making,
photoshop,
pie
0
comments
Making Pie Chart Graph in photoshop
Pie Chart -Infographics
Final view

Step 1:
Create new file in Photoshop.
Fill it with white color (Shift+f5 -> color).
Add rulers at middle of the screen
By selecting Circular shape tool add circle from center. (press and hold Shft and Alt key while drawing circle for perfect shape)
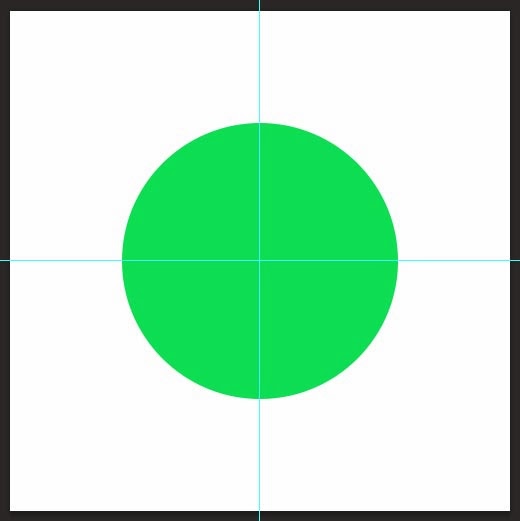
Step 2:
- Make 3 duplicate layers of this layer.
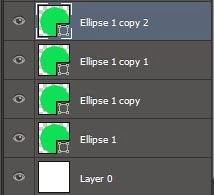
-By double clicking on Layer each Thumbnail, color each circle.
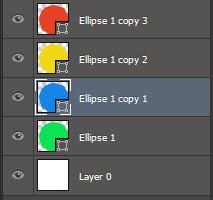
Step 3:
- Select upper layer (filled with red color), and selecting Polygonal Lasso Tool, make a selection from center of circle.
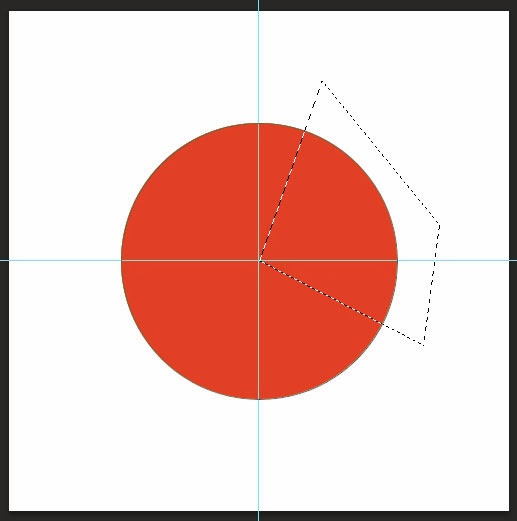
- Select upper layer (filled with red color), and selecting Polygonal Lasso Tool, make a selection from center of circle.
- ow add Layer mask to this layer by clicking on Add Layer Mask icon near the layer style icon.
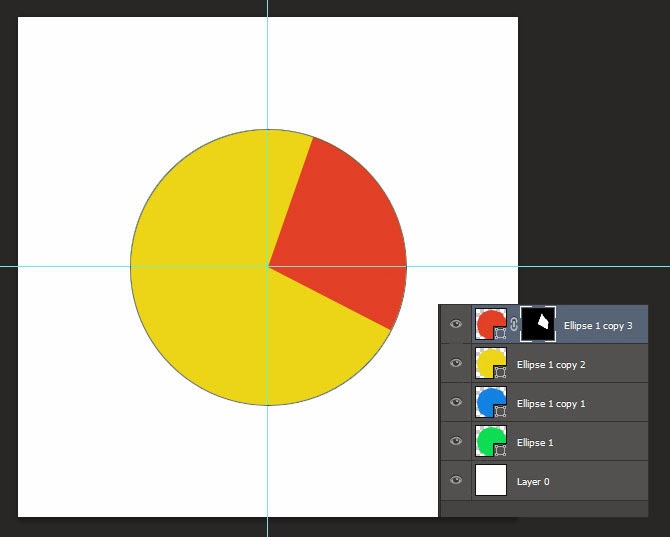
- Similarly Select another layer (Yellow color circle), and make a selection with Polygonal Lasso Tool, and add layer mask
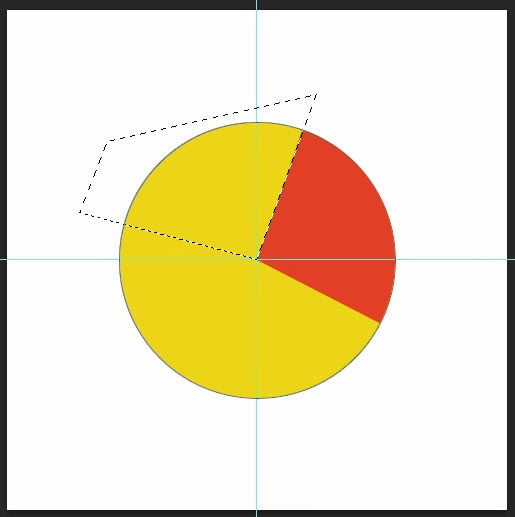

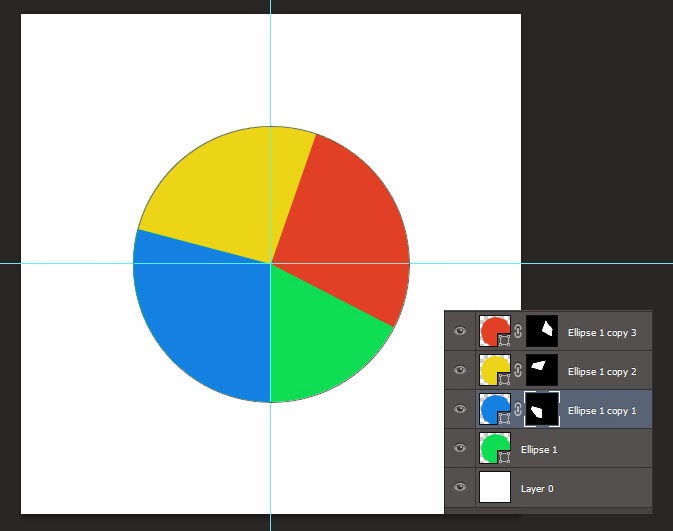
- Similarly add masks to all 4 layers. Your graph and layers looks like this.
Step 4:
- Select 1st Layer (Red colored circle), go to layer style and select Inner Glow.
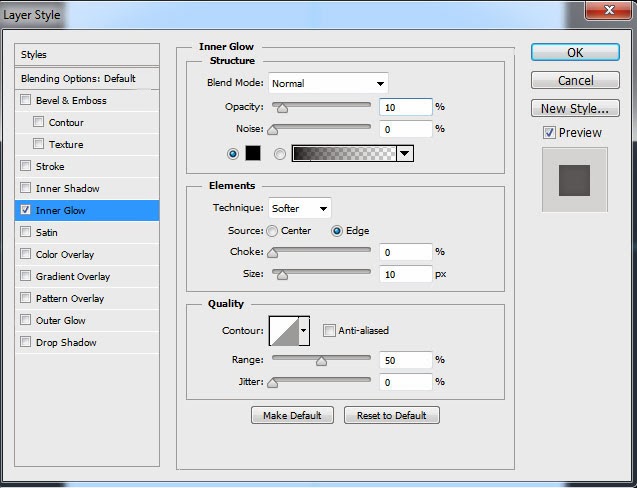
- Now Right click on this layer and select option "Copy Layer Style"
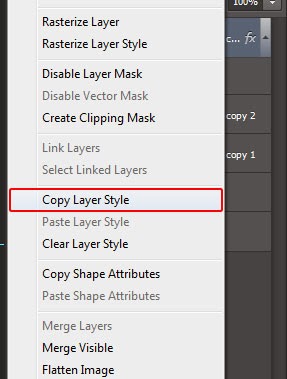
- Select other layers one by one, and by right clicking on them, select "Paste Layer Style"
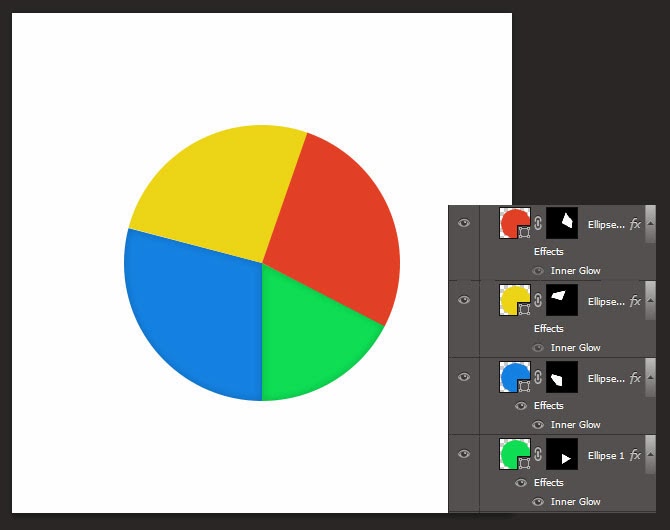
Step 5:
- Select Circular Shape tool, and by pressing and holding Shft + Alt draw a circle smaller than original circle, form center in white color.

Step 6:
- Go to layer style and give some outer shadow with black color.

Download Free PSD of Pie-Chart.
DOWNLOAD PSD
More about Author
Subscribe to:
Posts (Atom)


- Follow Us on Twitter!
- "Join Us on Facebook!
- RSS
Contact