Pie Chart -Infographics
Final view

Step 1:
Create new file in Photoshop.
Fill it with white color (Shift+f5 -> color).
Add rulers at middle of the screen
By selecting Circular shape tool add circle from center. (press and hold Shft and Alt key while drawing circle for perfect shape)

Step 2:
- Make 3 duplicate layers of this layer.
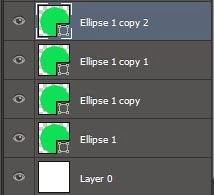
-By double clicking on Layer each Thumbnail, color each circle.
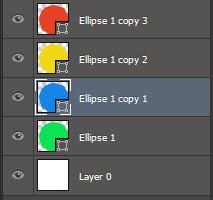

Step 3:
- Select upper layer (filled with red color), and selecting Polygonal Lasso Tool, make a selection from center of circle.
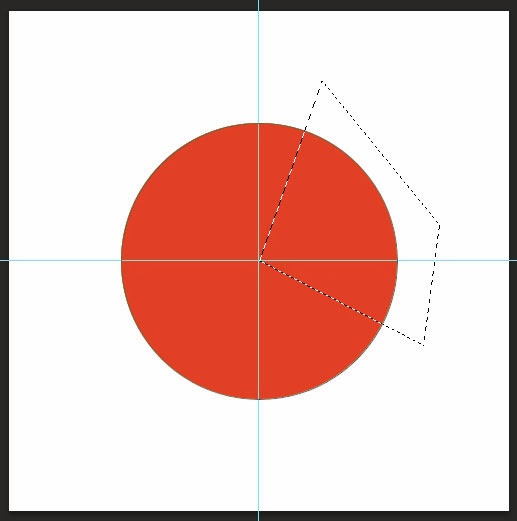
- Select upper layer (filled with red color), and selecting Polygonal Lasso Tool, make a selection from center of circle.

- ow add Layer mask to this layer by clicking on Add Layer Mask icon near the layer style icon.
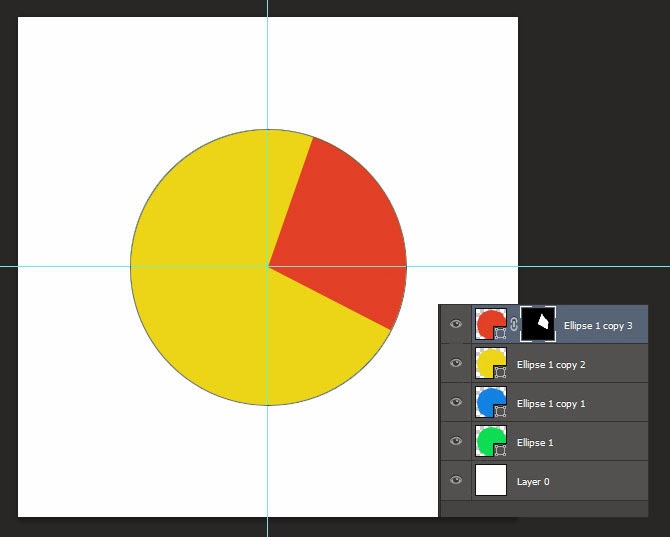
- Similarly Select another layer (Yellow color circle), and make a selection with Polygonal Lasso Tool, and add layer mask
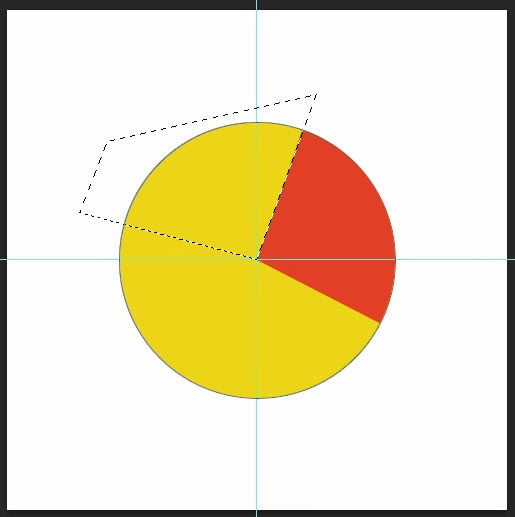

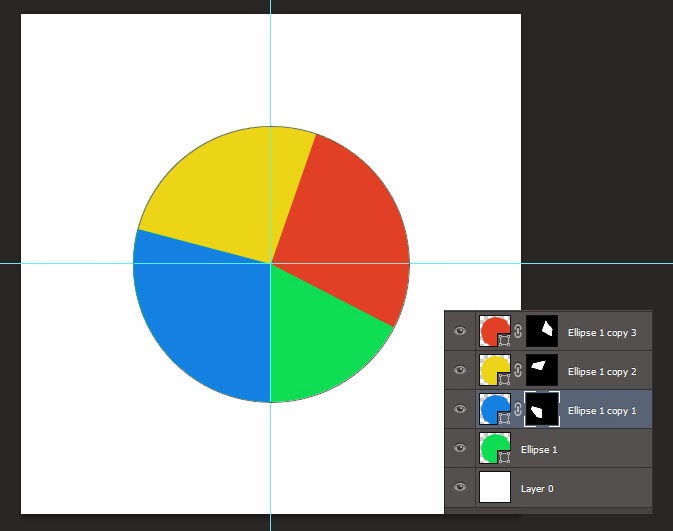


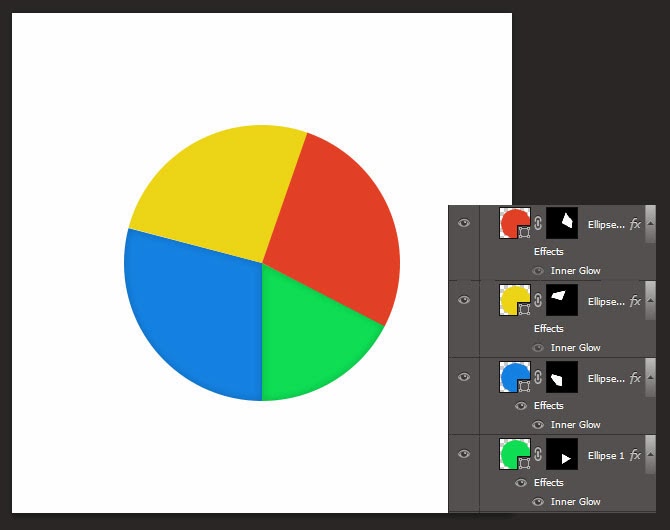
- Similarly add masks to all 4 layers. Your graph and layers looks like this.

Step 4:
- Select 1st Layer (Red colored circle), go to layer style and select Inner Glow.
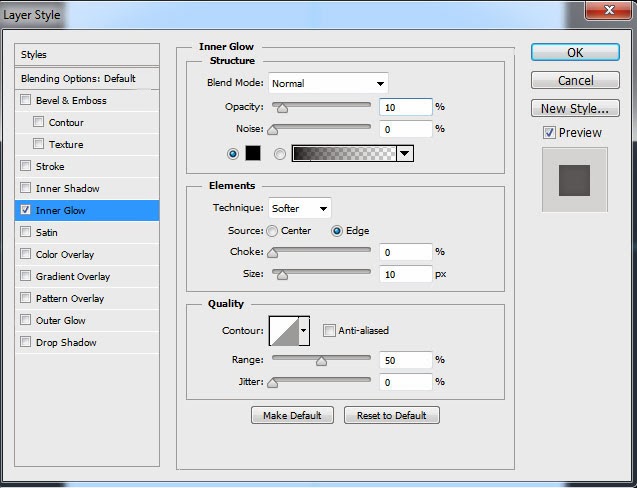
- Now Right click on this layer and select option "Copy Layer Style"
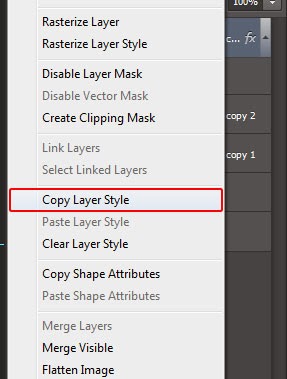
- Select other layers one by one, and by right clicking on them, select "Paste Layer Style"
Step 5:
- Select Circular Shape tool, and by pressing and holding Shft + Alt draw a circle smaller than original circle, form center in white color.

Step 6:
- Go to layer style and give some outer shadow with black color.

Download Free PSD of Pie-Chart.
DOWNLOAD PSD
More about Author
Subscribe to:
Post Comments (Atom)


0 comments:
Post a Comment